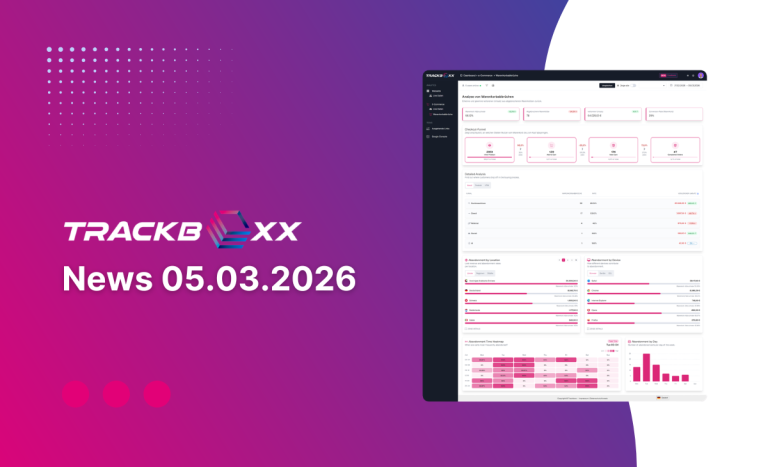
In e-commerce, small details often determine whether a visitor completes a purchase or leaves the shop again. This is exactly where our latest Trackboxx update comes in: The Page for analysing shopping basket cancellations has been completely revised and now offers much deeper insights into the checkout process.
The aim of the new version is not just to show, how many shopping baskets are cancelled, but above all Why and at what point in the purchase process users drop out.
Checkout tunnel at a glance
A central element of the new site is the Checkout funnel analysis. It visualises the entire path of a user through the purchasing process:
Product view → Shopping basket → Checkout → Order
This makes it possible to immediately recognise at which point visitors drop out particularly frequently. Shop operators can thus specifically check whether, for example, the shopping basket, the checkout process or certain technical factors are leading to cancellations.
Analysis by traffic source
The new version can also be used to analyse, Which channels are used for shopping basket cancellations.
Trackboxx shows, among other things:
- Cancellations via search engines
- Direct traffic
- Social media visitors
- Referral traffic
- AI traffic
The additional evaluation of the lost sales per source. This quickly reveals which channels are losing the most potential.
Device and browser analysis
Another important component of the new analysis is the Analysis by devices and browsers.
If, for example, shopping basket cancellations are above average for a particular browser or device, this can indicate Technical problems in the checkout point out. This provides shop operators with valuable information for optimisation.
Geographical insights
Geographical data was also integrated. The new analysis shows, from which countries shopping baskets are cancelled particularly frequently and what turnover is lost in the process.
This information can help with the evaluation of international campaigns or shipping options, for example.
Heatmap: When shopping baskets are cancelled
Another new feature is a Heatmap by time and day of the week. It shows when shopping baskets are cancelled particularly frequently.
This allows patterns to be recognised, for example:
- Peak times with many cancellations
- unusual demolition tips
- Differences between weekdays
More transparency in the checkout
Trackboxx is pursuing a clear goal with the new shopping basket abandonment analysis: Create more transparency in the purchasing process.
Shop operators thus gain significantly better insights into the checkout funnel and can identify more specifically where there is potential for optimisation - be it in the design, in the technology or in the order process.
The new analysis is now available in the dashboard at:
E-commerce → Shopping basket cancellations